Those of you who attended OMFW 2013 received a talk on Windows 8 and Server 2012 memory forensics with Volatility. One of the interesting aspects of this new operating system, which includes 8.1 and 2012 R2, is that the kernel debugger data block (_KDDEBUGGER_DATA64) is encoded by default on the 64-bit versions. As noted in Takahiro Haruyama’s blog, this capability has been present since Vista, but only enabled in certain situations. Whether you’re dealing with one of those special circumstances from a Vista/2008/7 system, or if you’re analyzing memory from a more recent Windows 8 or 2012 system, the question remains — what can you do about it?
An encoded KDBG can have a hugely negative effect on your ability to perform memory forensics. This structure contains a lot of critical details about the system, including the pointers to the start of the lists of active processes and loaded kernel modules, the address of the PspCid handle table, the ranges for the paged and non-paged pools, etc. If all of these fields are encoded, your day becomes that much more difficult.
>>> dt(“_KDDEBUGGER_DATA64”)
‘_KDDEBUGGER_DATA64’ (832 bytes)
0x0 : Header [‘_DBGKD_DEBUG_DATA_HEADER64’]
0x18 : KernBase [‘unsigned long long’]
0x20 : BreakpointWithStatus [‘unsigned long long’]
0x28 : SavedContext [‘unsigned long long’]
0x30 : ThCallbackStack [‘unsigned short’]
0x32 : NextCallback [‘unsigned short’]
0x34 : FramePointer [‘unsigned short’]
0x38 : KiCallUserMode [‘unsigned long long’]
0x40 : KeUserCallbackDispatcher [‘unsigned long long’]
0x48 : PsLoadedModuleList [‘pointer’, [‘_LIST_ENTRY’]]
0x50 : PsActiveProcessHead [‘pointer’, [‘_LIST_ENTRY’]]
0x58 : PspCidTable [‘pointer’, [‘pointer’, [‘_PSP_CID_TABLE’]]]
[snip]
As Takahiro points out, acquiring memory in crash dump format may help you evade this problem altogether, because some APIs used to create crash dumps will automatically decode the data before writing it to the crash dump file. They do this so Microsoft’s debugger (Windbg) can find and read the structure when necessary. In fact, by simply attaching a kernel debugger to a target system, the KDBG structure will be decoded. However, tools that acquire memory in raw format (with no headers, no meta-data, etc.) will not preemptively decode the data, and raw memory dumps, including virtual machine snapshot memory files, are by far the most common format — since practically all analysis tools accept them as input.
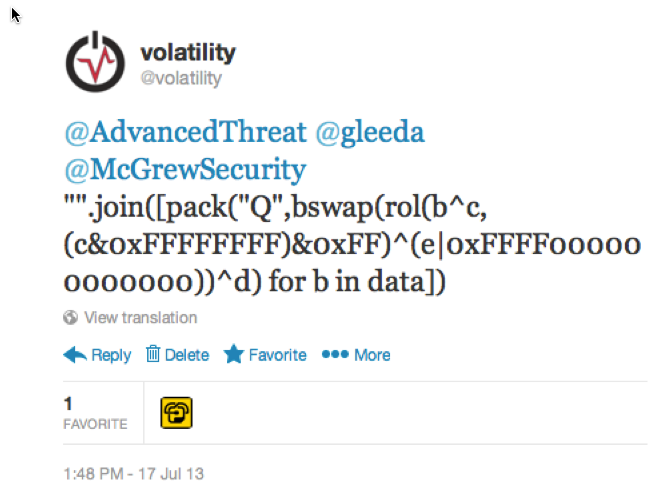
The answer to the problem lies within the NT kernel module, specifically in a function named KdCopyDataBlock. Here you will find a few variables, such as KiWaitNever and KiWaitAlways which are set based on the value of the timestamp counter (RDTSC) when the system boots (these values are also involved in pointer obfuscation for Patchguard2). Using those values in combination with a small formula, which we tweeted back in July 2013, you can fully decode the KDBG structure in raw memory dumps and access its members per the usual.